Wall Street’s Trade of the Year is in Full Force – July 18, 2024
We’re witnessing one of the most powerful rotations in recent history.
And it has more room to run…
Wall Street’s trade of the year is in full force.
Rarely does a rotational quake strike equity markets. But when positioning reaches extremes, it’s only a matter of time before a breath-taking unwind occurs.
Literally one month ago we made the unpopular case to get ready for a monster reversion trade for the ages.
In that post, we highlighted the extreme overweight positioning in a select few mega-caps relative to the average stock. This setup had all the ingredients to kickstart a violent catchup trade.
All that was needed was a spark to get the fire started.
Two pivotal events occurred in the past 5 trading days to cement one of the greatest catchup trades in years:
- June’s ice-cold CPI reading all but guaranteed an interest rate cut at the September Fed meeting
- Former president Donald Trump’s failed assassination attempt, strengthened his odds of winning in November – sending the Trump Trade into high gear
As I will show you, these 2 events caused a mammoth reshuffling of equity positions…each fueling the biggest trade of 2024: The unwind of crowded mega-cap Tech bets to finance massive unpopular small cap inflows.
Folks, this is THE TRADE of the year.
Now, let’s visualize this historic moment through the lens of data. Then I’ll make a data-driven case that small-caps can keep flying in the months ahead.
Wall Street’s Trade of the Year is in Full Force
To kick things off, let’s review how powerful the past week’s small-cap surge has been.
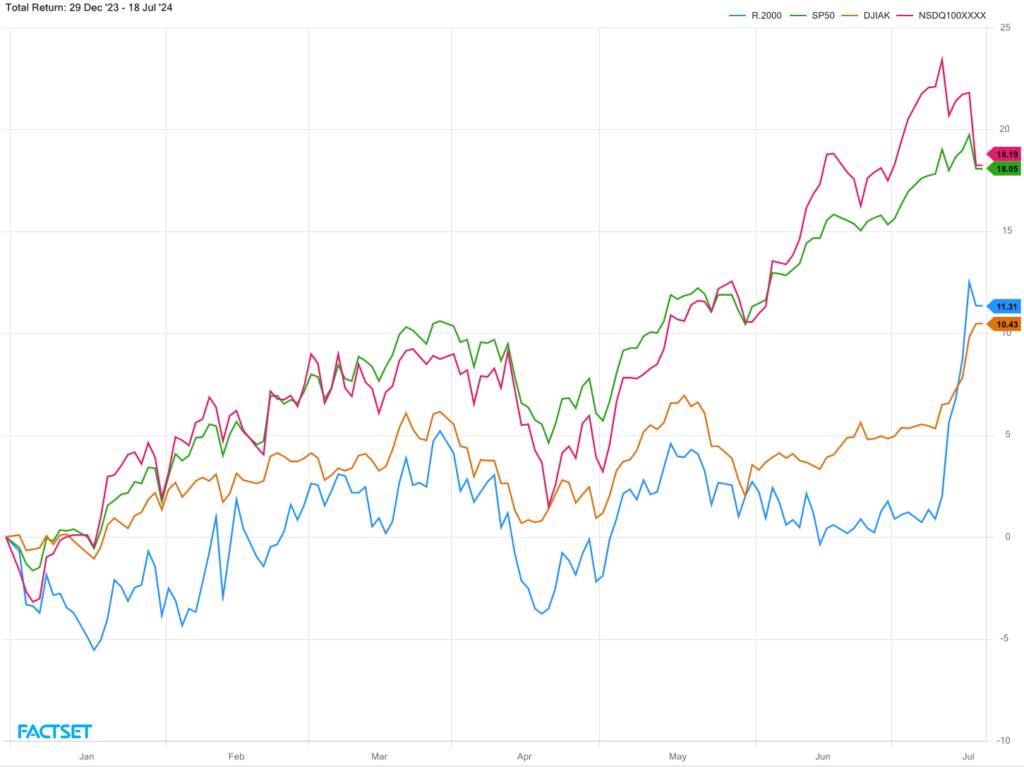
Below reveals the latest year-to-date returns for major equity benchmarks. In just a handful of days, the Russell 2000 has vaulted, clocking in at an 11.31% performance.
This puts small-caps ahead of the Dow Jones Industrial Average’s YTD lift of 10.43%…something few could have imagined just a week ago!
Also notable is the recent drag of large-cap weighted benchmarks, S&P 500 and NASDAQ 100, with each gaining 18% through yesterday:
But let’s drill down to the true situation unfolding. What’s occurring is a monster reversion trade out of ultra-crowded bets on mega-cap tech and into the most hated area: small-caps.
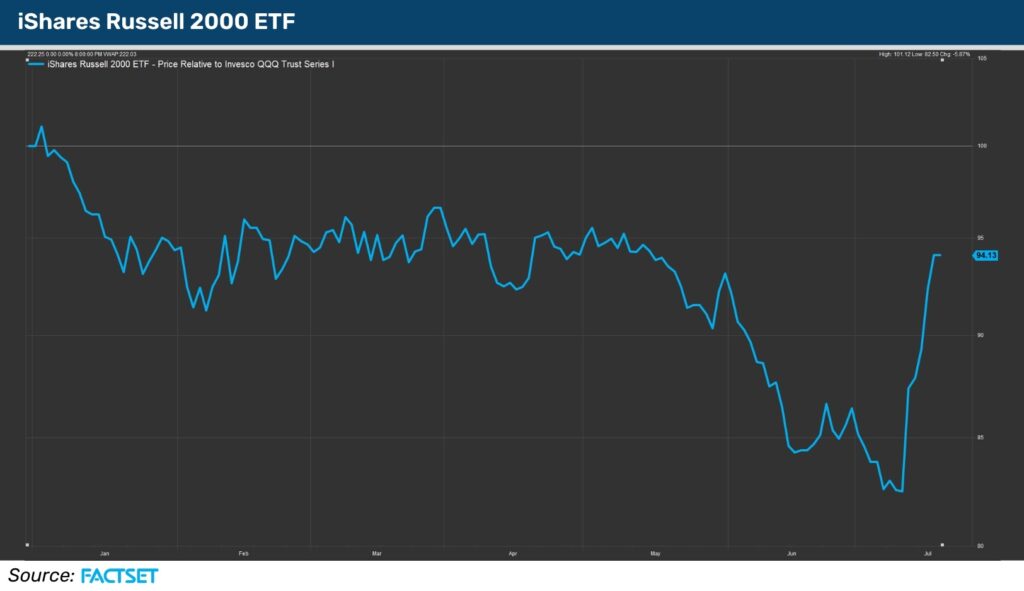
This seismic shift is eye-popping when you zero in on the relative performance of the Russell 2000 ETF (IWM) and the NASDAQ 100 ETF (QQQ). As you can see off to the right, the vertical rip indicates a violent rotation out of mega-cap tech and into heavily under-owned small-caps:
The spark that initially set this reshuffling into high gear was the June CPI report revealing the battle on inflation is over. The green light for the Fed to cut rates was clear as day.
The reason small-caps have been dead money for years is due to high interest rates which penalize lesser-capitalized firms. Higher rates also meant mega-caps with pristine cash-heavy balance sheets would enjoy large interest income on those dollars.
Simple enough! BUT it didn’t take long for that narrative to get challenged.
If rates are going lower, that signals less income in the future for cash hoards, and more importantly, less costs to service debts for smaller businesses.
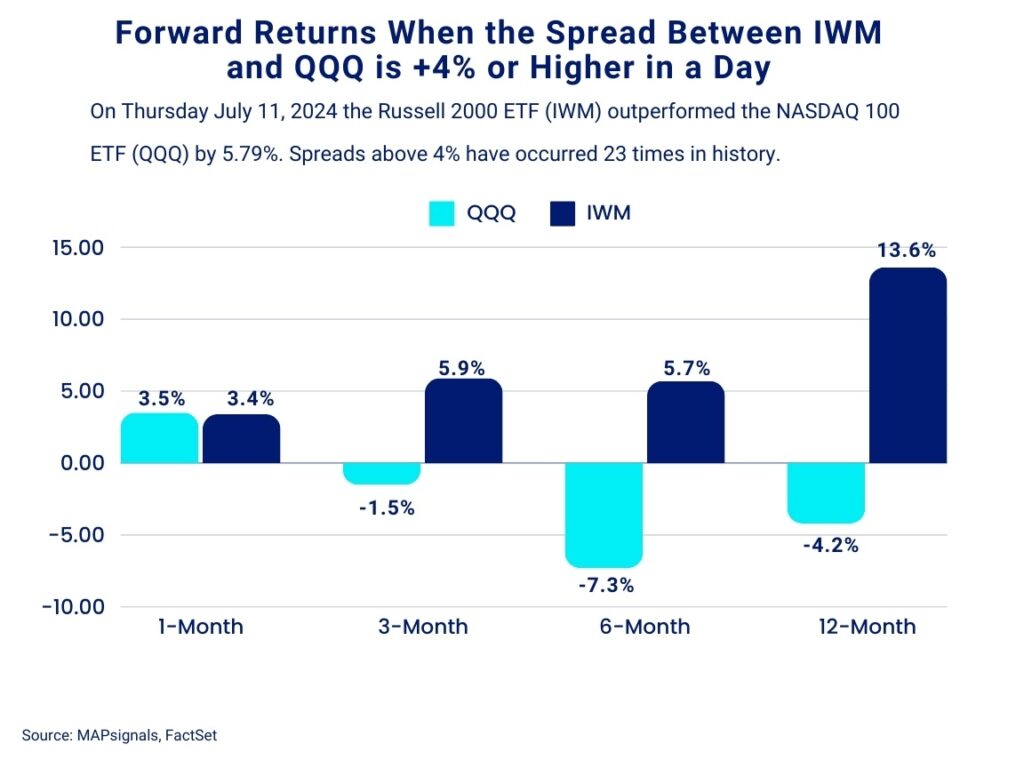
This new realization caused a blow-out trade on Thursday July 11th. The Russell 2000 ETF (IWM) gained 3.59% while the NASDAQ 100 ETF (QQQ) plummeted 2.19% – resulting in a +5.79% spread in favor of small-caps.
That is a historic move that’s only been topped twice, both in 2000.
Here’s reason number 1 to keep an overweight allocation to small-caps. I went back and found 23 instances where the IWM/QQQ spread was at least 4%.
Most of these occurred during trying macro moments like 2000, 2001, 2008, and 2020. Here’s the forward returns of IWM and QQQ post these events:
- 6-months later IWM gains an average of 5.7% while QQQ drops 7.3%
- 12-months later, IWM rips 13.6% while the NASDAQ 100 (QQQ) slips 4.2%
This was an insight I shared with our PRO members on Friday morning, making the case that this rotation has further to go.
But there’s more –
The reversion narrative got a 2nd wind after the former assassination attempt on former President Donald Trump hit last Saturday.
The shots heard around the world sent odds of his re-election in November soaring to 67%.
If there’s one thing that Wall Street hates, it’s uncertainty…stronger odds of a victor has huge portfolio implications.
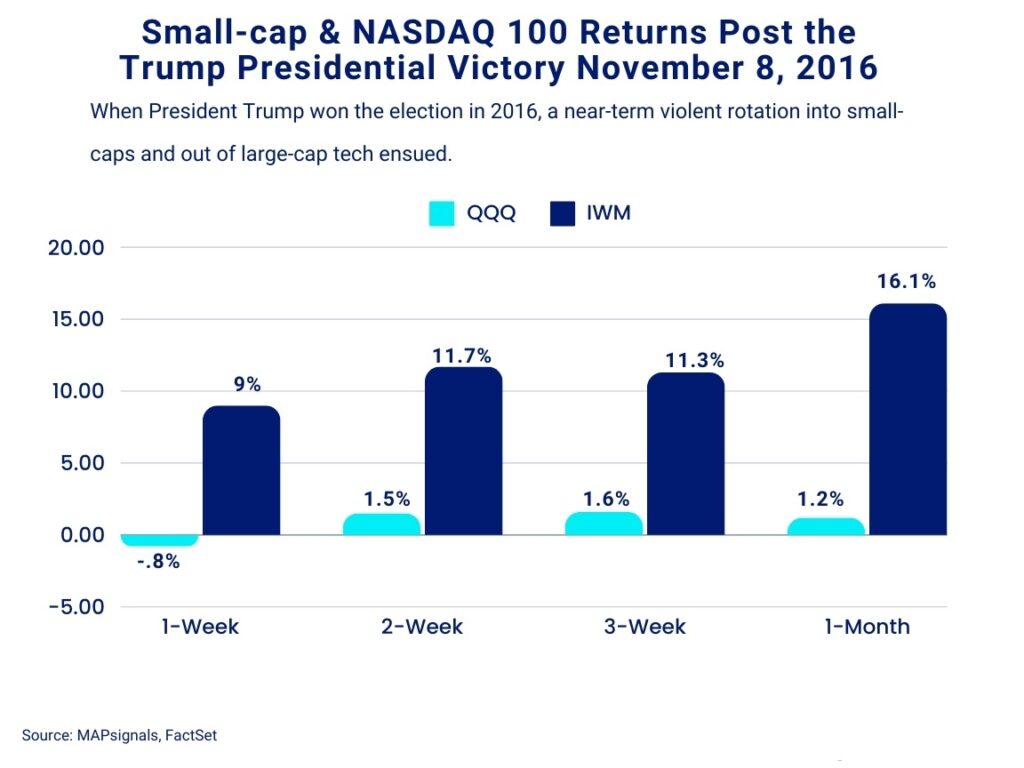
Reason number 2 to keep an overweight allocation to small-caps is the Trump Trade. Those who were around in 2016 when Trump shocked the crowd with a victory may remember the violent rotation that occurred…mimicking today’s action to a T.
In the month following Trump’s 2016 victory, small-caps surged while the NASDAQ 100 massively underperformed.
Check out this chart. This is the Trump Trade that I vividly remember back in 2016 after Trump won the vote:
- One week later the Russell 2000 ETF (IWM) soared 9%, while the NASDAQ 100 ETF (QQQ) fell .8%
- 1-month later IWM surged 16.1% and QQQ eked out a gain of 1.2%
By now it should be coming into focus…Wall Street’s Trade of the year is in full force.
It’s all the same trade. The equalizing event is here. NOW.
And by the looks of money flows, there’s room for this rotation to keep going.
Our market North Star, the Big Money Index (BMI) is firmly in an uptrend. More importantly, it’s far from overbought.
Here I’ve overlaid the BMI on IWM as that’s where the money’s flowing. At a 50% reading, there is evidence that money will continue to find its way into small-cap companies:
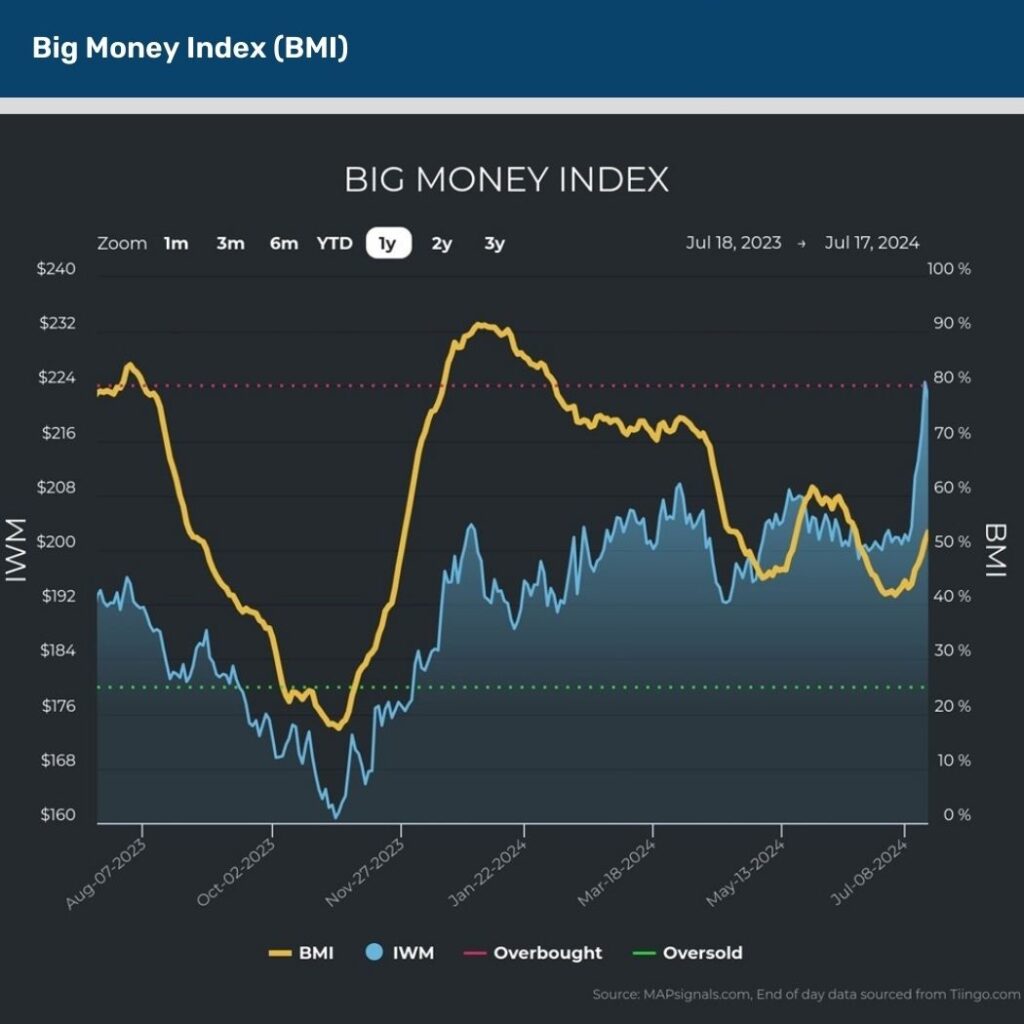
I can confidently say that due to the market-cap mix of inflows we’ve tracked since the CPI report.
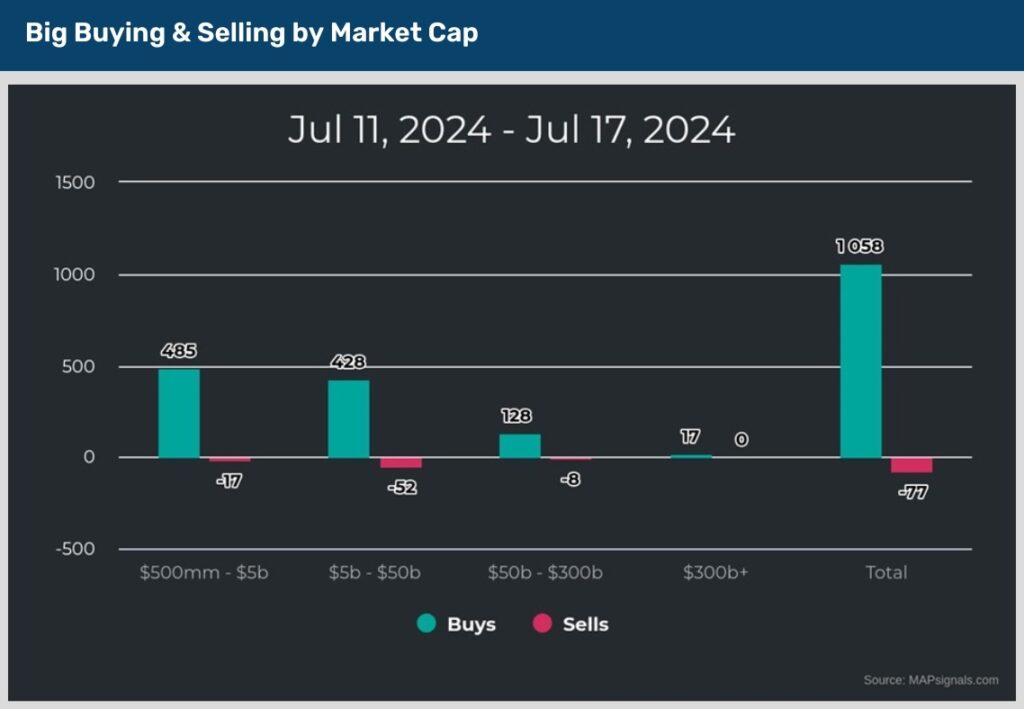
Here we can see that an incredible 1058 stocks were bought the last 5 trading days. That’s an immense number!
Importantly, 93% of those buy signals were in equities of $50B or less…aka the most under-owned area the last couple of years:
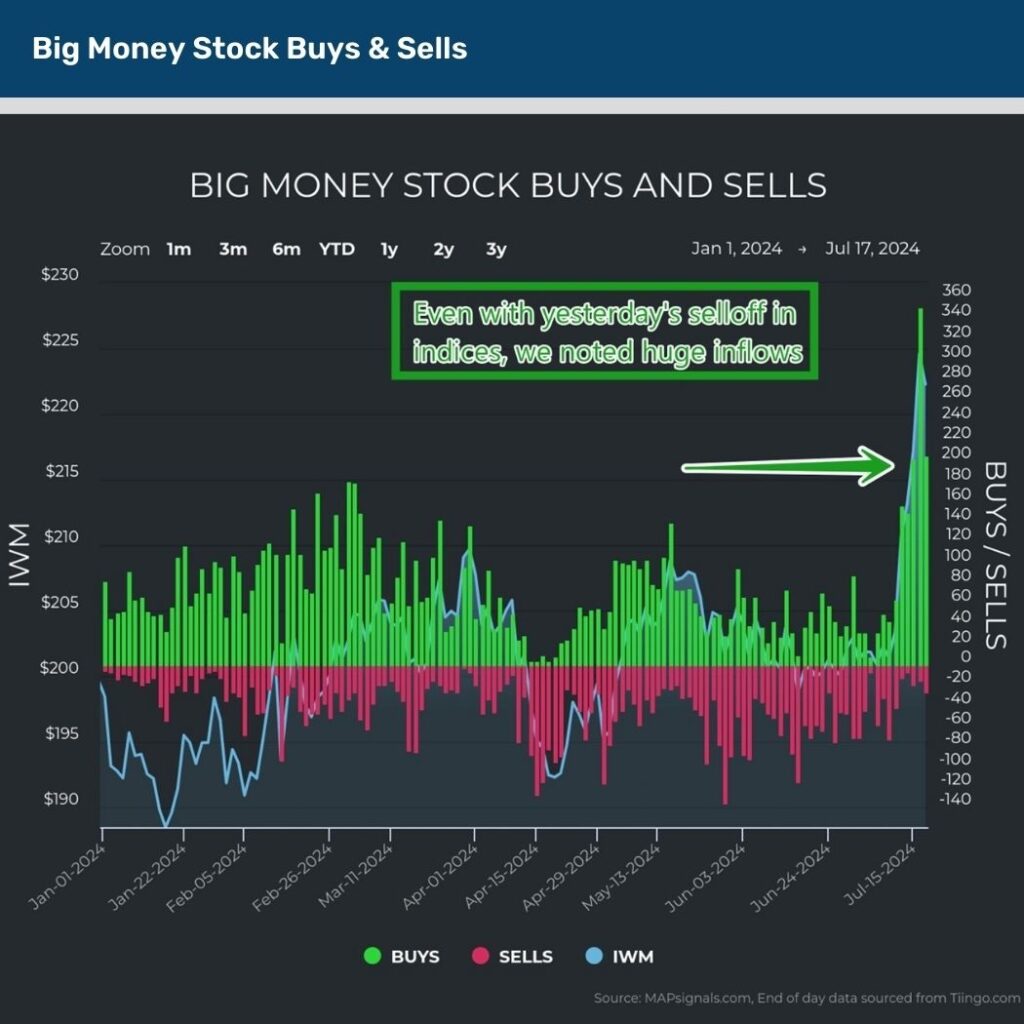
And to prove that Wall Street’s trade of the year is in full force, look at yesterday’s action through our money flow lens.
It was a huge buy day, revealing what’s happening hidden under the surface.
Look at this.
206 stocks were bought on a day when all indices were red – that’s the key to let us know new leadership is here:
Folks, what I suggested a month ago needs to be said again:
Market breadth readings indicate an undeniable truth: most stocks in the S&P 500 are vastly underperforming a handful of mega-cap behemoths.
Since 2007, this trend has rarely lasted long. More importantly, the setup is incredibly bullish for the under-loved stocks in the market.
If history is a guide, we will be looking at a monster reversion trade where the equal weighted S&P will play catch up to the market bellwethers.
Once this powerful trend begins, you can bet that our unique data will be all over it…highlighting tomorrow’s winners today.
This is THE TRADE. One that will be studied in history books years from now.
Don’t wait for the media to signal the green light…you’ll miss the train.
Follow the market map!
Here’s the bottom line: A monster reversion trade has sent small-caps surging as mega-caps take a healthy breather.
History shows us that when the spread between IWM and QQQ blows out, small-cap dominance follows. This is great news for those bench-warming stocks that’ve been dead money for years.
Add to it the Trump Trade is playing out to a T…and you have a recipe for further small-cap appetite.
Our unique data concurs that Wall Street is still betting on cyclical small-caps given the healthy buying seen yesterday.
This trade unwind is historic and one that you don’t want to miss.
Author: Lucas Downey