How the S&P 500 Can Reach 5900 By Yearend – August 22, 2024
Think the market’s done going higher?
Think again.
There’s more pain coming for the bears.
Today, we’ll make the data-driven case of how the S&P 500 can reach 5900 by yearend.
Here’s the reality, stocks have an incredibly strong setup on the macro front:
- Fed rate cuts are on the way
- earnings are expanding
- and trillions of dollars in dry powder are hiding in high-yielding money markets.
These few facts alone are a powerful cocktail to keep the bull run in place.
But there’s plenty more fuel for the bullish narrative. As a refresher, one of my favorite bullish cues struck just 2 weeks ago when rare capitulation hit markets and we told you to go buy stocks.
Forced selling events are some of the most powerful near-term buy signals you’ll find.
Kudos to you if you bought the dip.
If you didn’t, that’s OK too.
History suggests this year’s momentum is far from over. But it won’t come without some bumps along the way.
How the S&P 500 Can Reach 5900 By Yearend
To kick things off, let’s take a look at our stock market North Star, the Big Money Index (BMI). This money-flow barometer can give us an idea of the true health of the average stock.
After August’s crash, markets have rebounded and the BMI is neither extremely overbought nor oversold. The latest reading is calmly near 60:
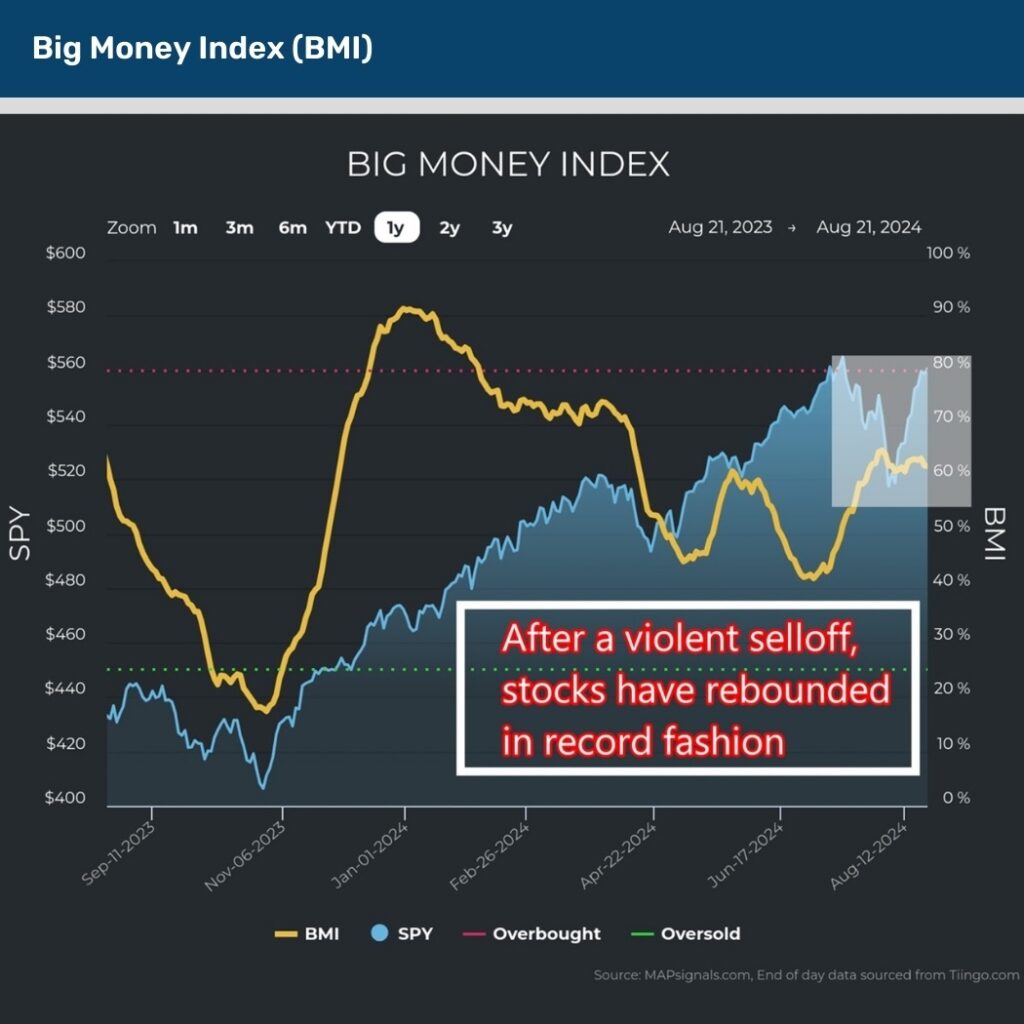
Diving below the BMI’s surface, this summertime quiet period we’re experiencing now is commonplace after extreme capitulation events.
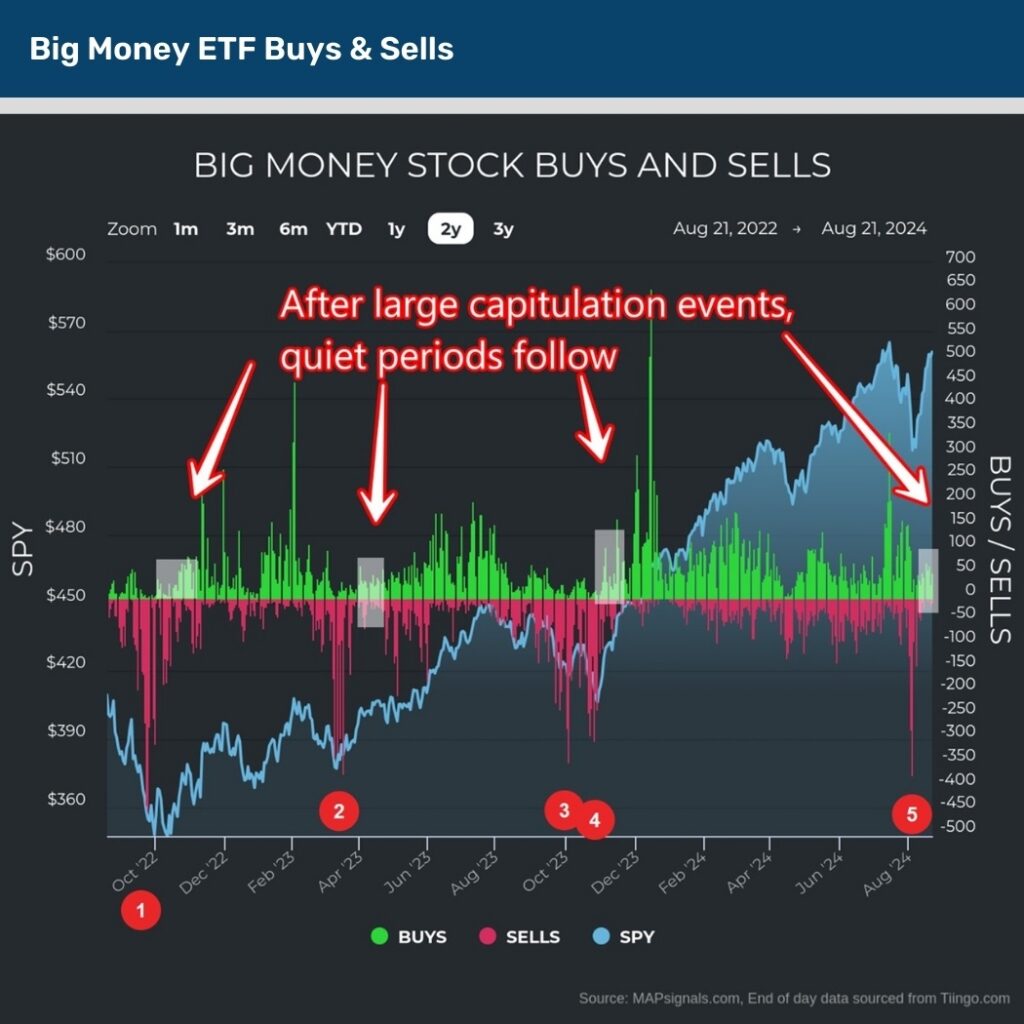
Below illustrates this phenomenon. Over the past 2 years, we’ve experienced 5 large daily drawdowns of similar magnitude to August 5th’s 374 stocks sold.
Note how these rough events are generally followed by muted buy/sell action afterwards:
But explaining the here and now rarely offers value… where we’re going next is what matters.
Before I beat the bullish drums, I need to set the stage for a decent possibility of near-term choppiness.
If you’ve been following our research for longer than a year, you’ll know that the month of September tends to be weak for equities.
You can check out our 2022 September warning. And our 2023 cautionary writeup.
The last 4 Septembers brought the following:
- September 2020 saw the S&P 500 fall 3.9%
- September 2021 saw stocks fall 4.8%
- September 2022 equities plunged 9.3%
- September 2023 saw the S&P 500 drop 4.9%
In fact, back to 1990 we know that the month of September is the weakest month of the year with an average pullback of -.9%:
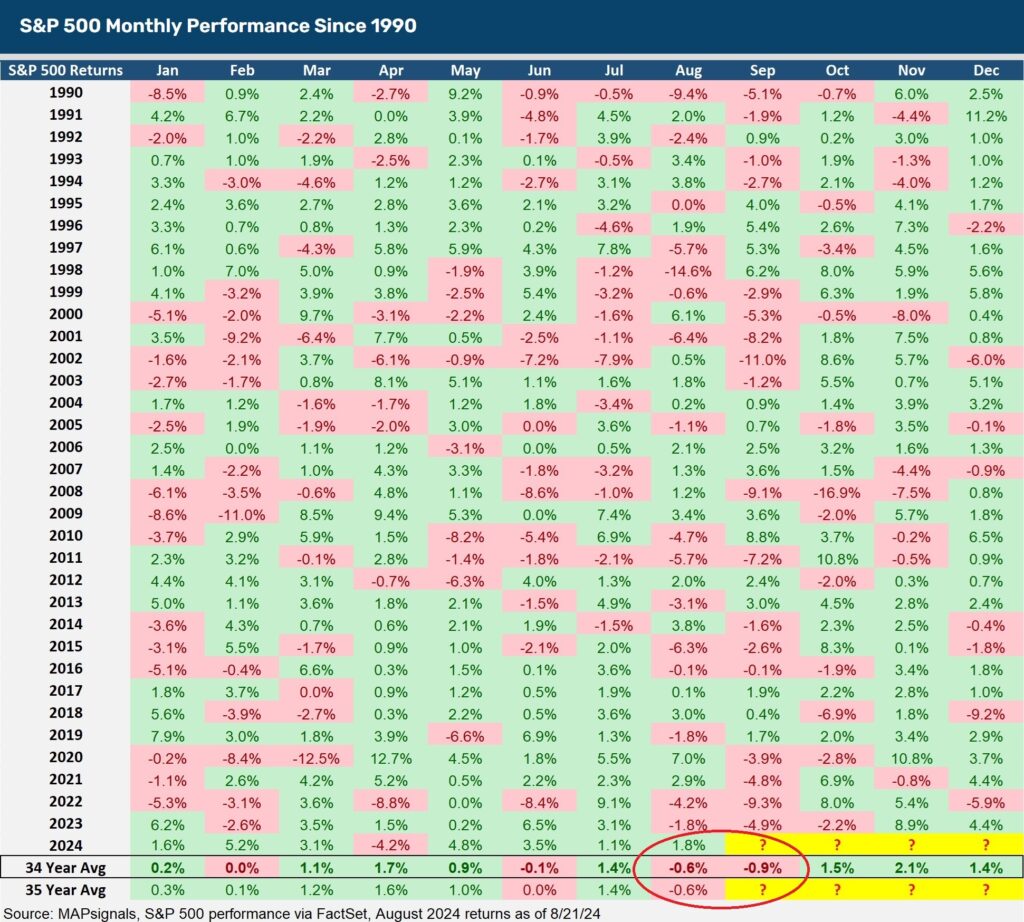
While it’s true that August and September are the weakest months of the year, let’s also not miss the other glaring fact that’s apparent.
October, November, and December kick off bullish season with 1.5%, 2.1%, and 1.4% gains respectively for the S&P 500.
But folks, we aren’t finished just yet. We still need to discuss how the S&P 500 can reach 5900 by yearend…here’s where today’s setup gets really interesting!
Let’s call a spade a spade. We’re in the midst of a mega risk-on rally in 2024. At last measure, the S&P 500 has gained 17.84% through August 21st.
Turns out, when markets climb 10% or more through August, the remainder of the year averages a market-beating 4.94%.
Check it out:
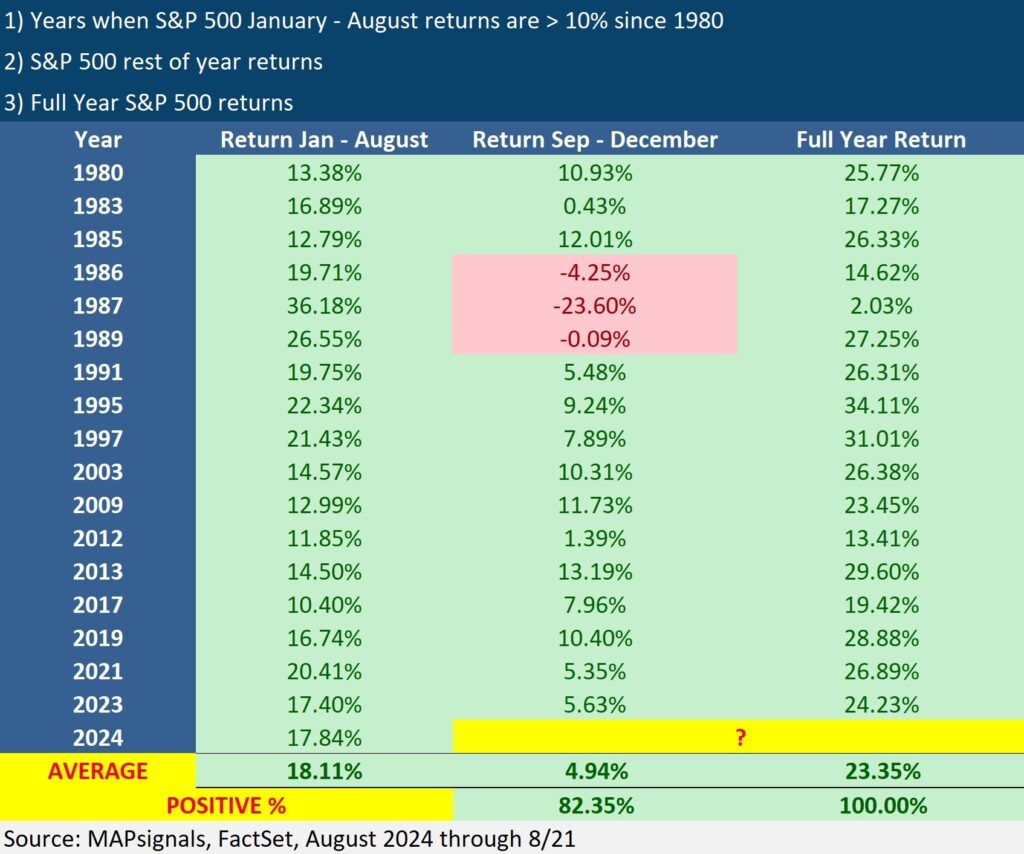
Why this study holds extra validity today is due to the fact that one year ago, we performed this same analysis and highlighted that the average September – December gain is 4.9% after a 10%+ jump through the first 8 months of the year.
That forecast hit the nail on the head with September – December 2023’s return of 5.63% for the S&P 500.
What this potentially means for 2024 is this. With the S&P 500 resting at 5620, a 4.94% gain takes the index to 5897.
And that’s how the S&P 500 can reach 5900 by yearend!
It’s simple.
Embrace any September dip…then ride the rip!
Let’s wrap up.
Here’s the bottom line: If you missed the call to buy stocks with both hands in early August, don’t fret. September notoriously brings red markets.
That’s a great hunting ground for scooping up all-star stocks unfairly punished.
Buy the dip!
And the reason for this call is due to the fact that strong momentum through August tends to spill over into the rest of the year.
When the S&P 500 gains at least 10% through the first 8 months of the year, the last 4 months average a 4.94% gain.
Add it all up and that’s how the S&P 500 can reach 5900!
Start planning now and building your stock buy list today.
Author: Lucas Downey