Election Volatility Risk– October 31, 2024
Want to divide a room? Ask a group who they’re voting for.
Want to inform a room? Arm the crowd with an election volatility risk playbook.
2 data-driven reasons suggest election volatility risk could be coming for your portfolio.
There are a lot of cross currents garnering investor attention right now: inflation risks, earnings, wars, and even deficits are in the limelight.
Truthfully, you can opine all day on those issues and never reach an agreement.
What’s not up for debate though are 2 hard-hitting facts which spell added volatility coming our way:
- A falling Big Money Index (BMI)
- Notable election volatility risk post the November vote
As it relates to the 2nd point, no matter if you’re a devout donkey or emphatic elephant, you’ll find value in today’s message.
There are powerful election patterns to understand and profit from.
But before we get into hard-hitting historical studies, let’s first unpack the money flow situation…lately, our most popular indicator has been sending a spooky message.
Big Money Index (BMI) Continues to Fall Ahead of Election
Last week’s update set the stage for downside risks for equities. When the BMI falls out of overbought territory, stocks often stumble.
This Line of Truth sheds light on institutional support for stocks. When it’s sinking, the bid for equities is shrinking.
Let’s review the illustration from last week:
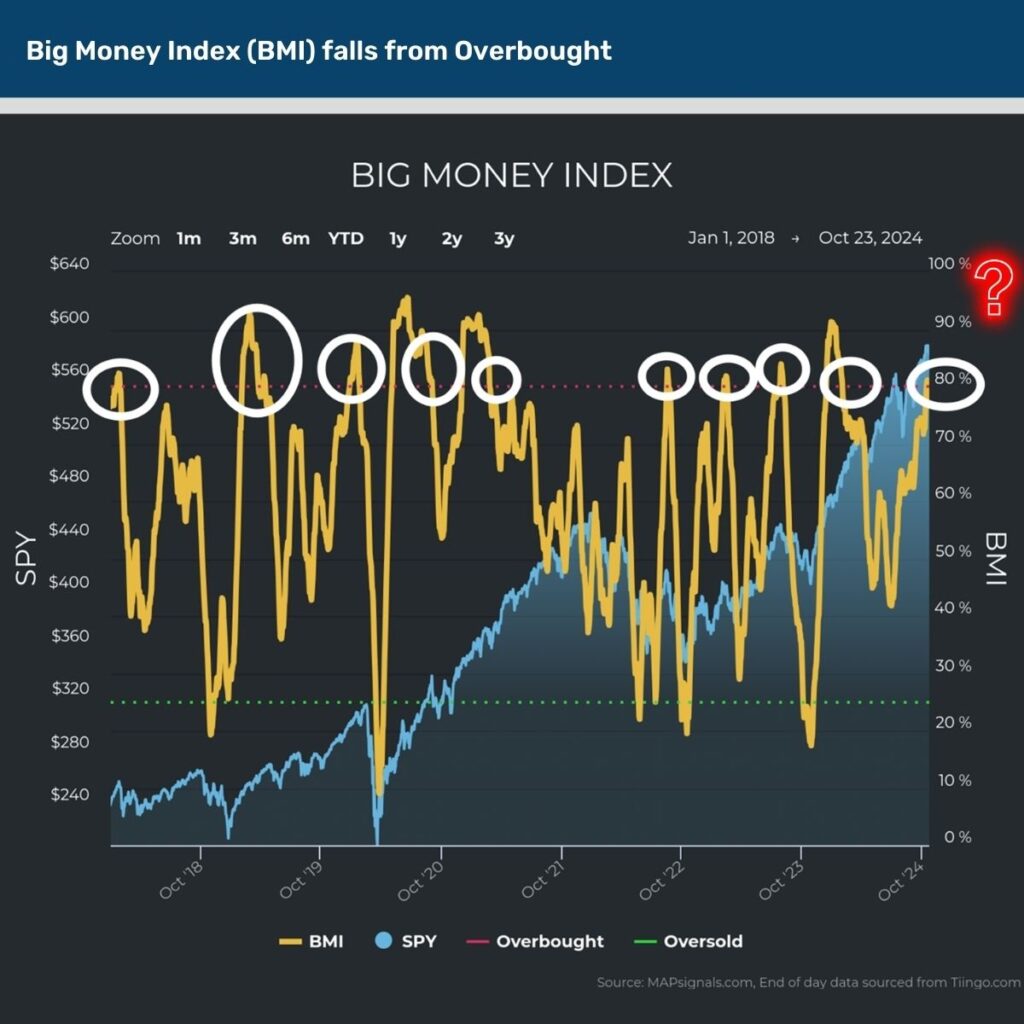
As of this morning, this North Star has a reading of 72%. That’s 9 points below the recent peak of 81% made on October 18th.
If you’re wondering why the sudden downshift is occurring, it comes down to 2 simple words: election volatility.
There’s nothing worse for Wall Street than uncertainty. Presidential elections elicit plenty of unknowns about the future.
Turns out, equity benchmarks behave wildly differently depending on who wins the Oval Office.
Here’s where you’ll want to get your notebooks out. This guide may come in handy for next week and beyond.
Prepare for Election Volatility Risk
Election years get the financial media in a tizzy. That’s simply due to the fact that election years have a painful history.
The Global Financial Crisis of 2008 can never be forgotten. The same goes for the epic Dot-com bust of 2000.
Let’s also not forget the COVID-19 pandemic of 2020!
Yes, there’s an ugly truth to stocks during election years.
But here’s the reality. When you cast a wider net, looking back further, you learn a few powerful repeatable behaviors.
Today’s studies include 5 Democrat and 4 Republican presidential winners. All returns begin from election day.
While we’re going to wade through a lot of data, don’t worry. By the time we’re finished you’ll have a straight forward gameplan.
Up first, let’s review the near-term picture for both large and -small cap stocks. Back to 1988, here’s how equities perform from election day:
- 1 and 2-weeks out sees both the S&P 500 and NASDAQ 100 fall on average
- 2-months later large-caps stabilize with the S&P 500 modestly gaining 2.4% and the tech-heavy NASDAQ gaining 1.4%
- Importantly, 2-months after the vote, the Russell 2000 averages a strong 6.6% rip
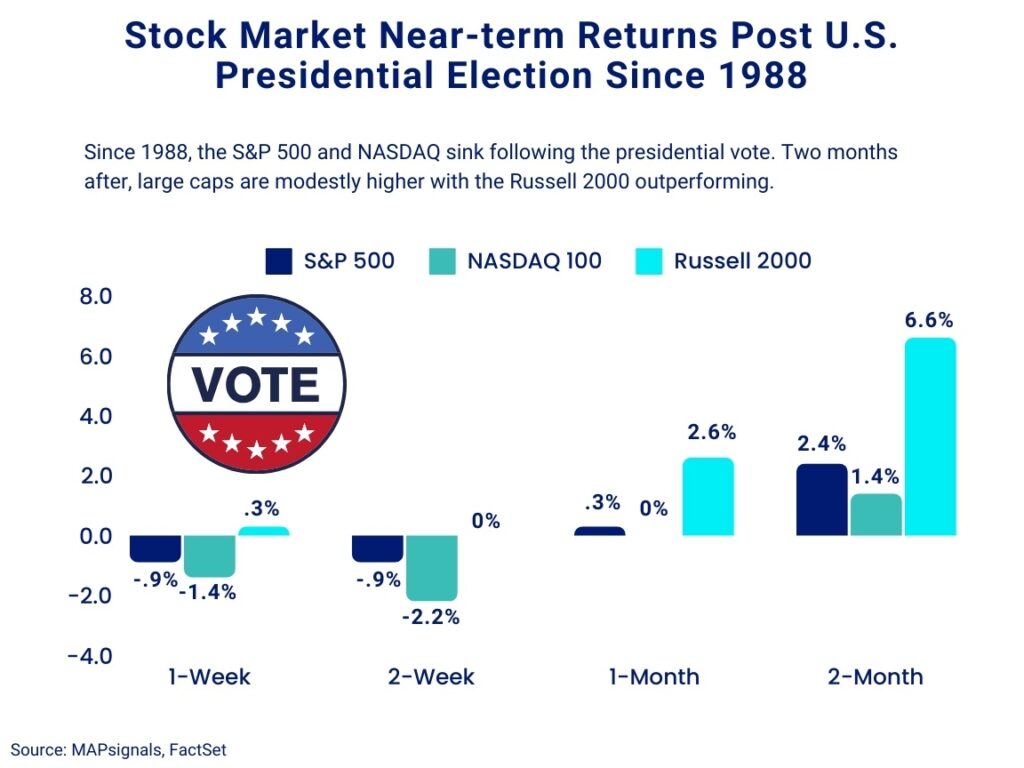
The reason Big Money investors are moving to the sidelines right now comes down to historical election volatility.
The initial takeaway is to expect a giveback for popular large-caps and a jolt for smaller stocks.
If you’re inclined to pull out the bear suit…hold tight. There’s a bigger picture to understand.
When you step back and expand the time horizon, you learn that election dips often lead to election rips.
Since 1988, all market cap sizes see healthy positive gains over the medium to longer-term:
- 6-months post the vote, the NASDAQ 100 jumps 5.6% followed by the S&P 500’s vault of 7.1%, and the Russell 2000 screams 10.6% higher
- Be bold with a 12-month hold and all major benchmarks show market beating gains of 15.3% for the S&P, 17.6% gains for the NASDAQ, and a whopping 20.4% rally for the smaller Russell 2000
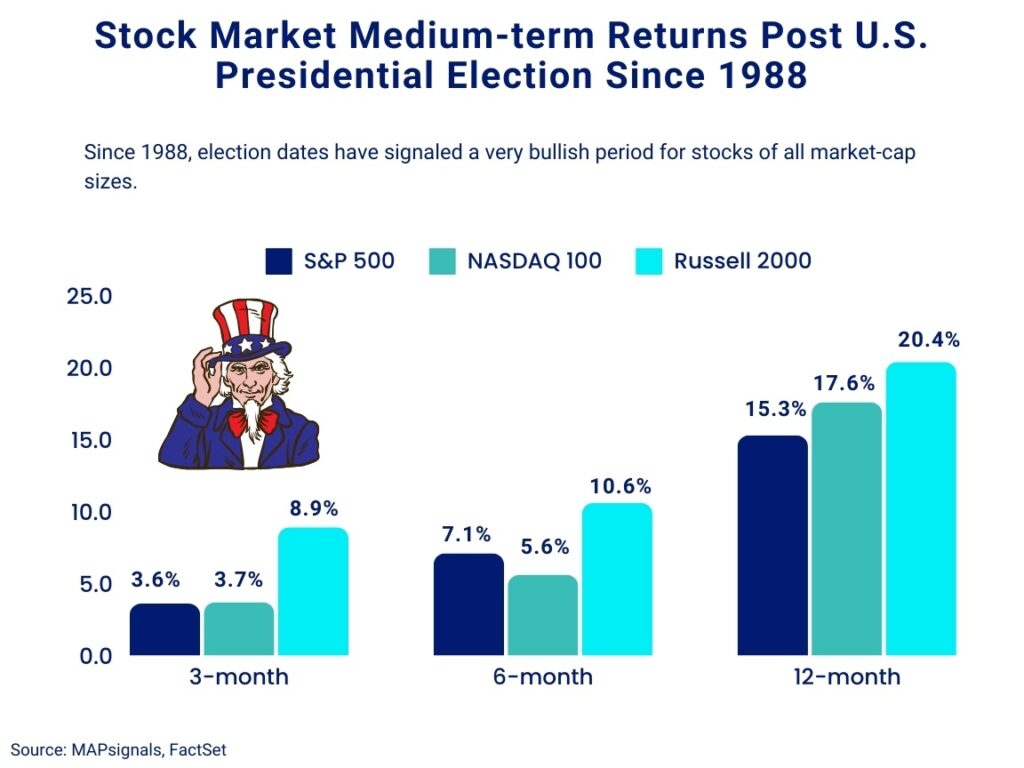
Don’t get too cute over the near-term wobbles…you may just miss a big fat rally if history is any guide.
Up to this point, note how small-caps have been a solid portfolio bet the last 3+ decades. This aligns with our against-the-crowd overweight stance on SMID caps for many months.
But let’s take our study a step further by answering the burning question on everyone’s mind.
What will happen to stocks if a Republican or Democrat wins next week?
Turns out, history sets the record straight.
What Do Stocks Do When a Democrat or Republican Becomes President
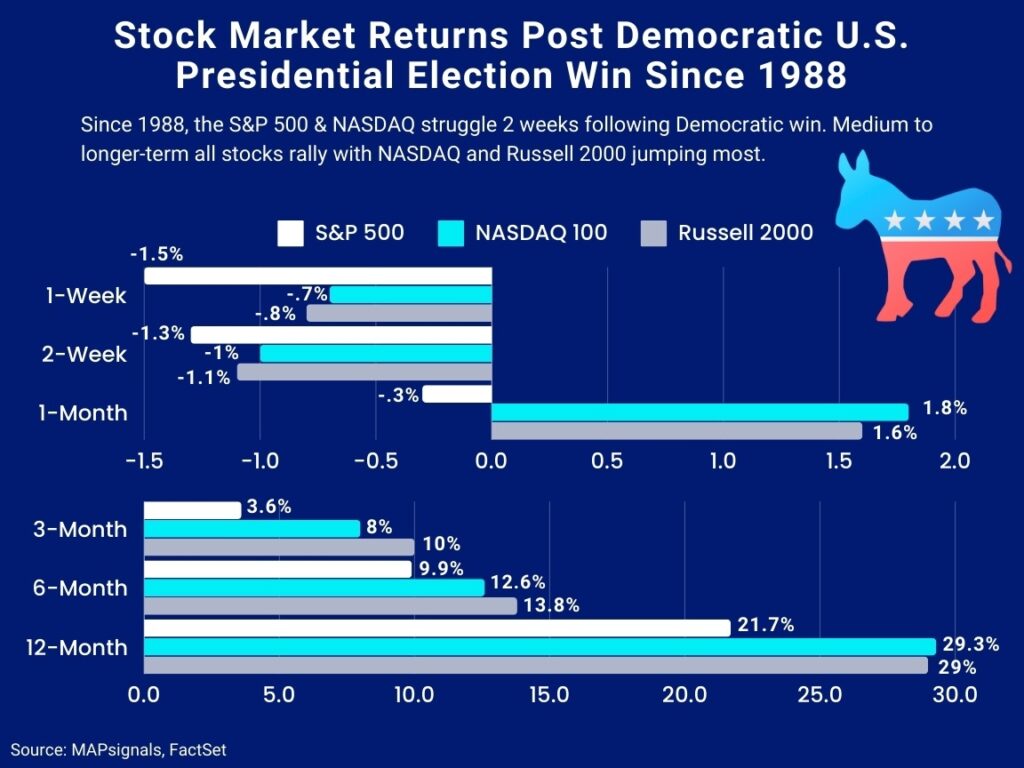
When we use the same framework and single out only Democrat presidential winners, a striking pattern emerges.
In the first couple of weeks after the vote, all stocks sputter. That’s followed by firming action months later.
Since 1988 when a Democrat wins the White House:
- The S&P 500, NASDAQ 100, and Russell 2000 fall 1 to 2-weeks later
- 1-month after sees the NASDAQ jump 1.8% and the Russell 2000 lift 1.6%
- Most important is the 12-month surge in the NASDAQ and Russell 2000 with 29.3% and 29% gains respectively
A win for blue has spelled great fortune for small-caps and tech stocks.
Finally, let’s discuss the elephant in the room…a red victory.
Get those notebooks out. Big dispersion trades have occurred after Republican triumphs.
Since 1988 when the GOP won the White House, NASDAQ stocks sputter while the S&P 500 and Russell 2000 gain.
A month after a Republican wins, the NASDAQ falls 2.3% on average while the Russell 2000 jumps 4%.
Looking out to 6-months, tech stocks are still lower by 3.1% while the S&P 500 rallies 3.6% and small caps jolt 6.8%.
12-months out the Russell 2000 ramps 9.6%.
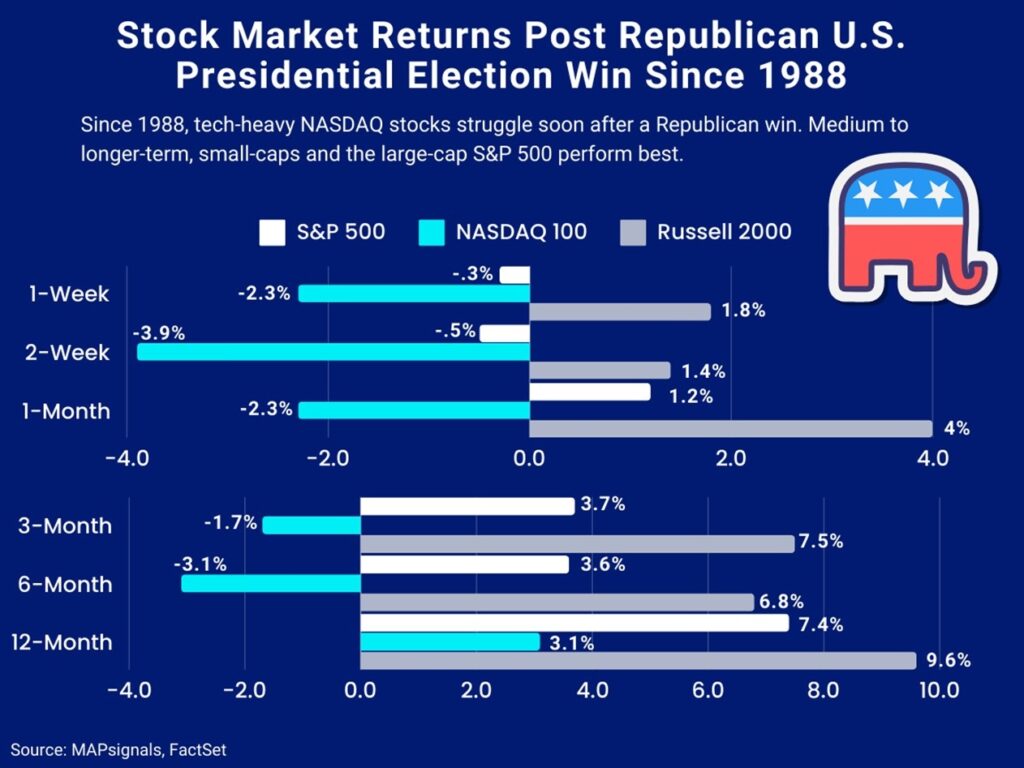
As we head into next week and beyond, keep this election volatility risk playbook handy.
Also note how small-caps have been an election benefactor in all scenarios. We believe portfolios need to have some sliver dedicated to small and mid-caps especially as we head into 2025.
There are lots of under the radar names under massive institutional sponsorship right now.
As we wrap up, odds clearly suggest institutional investors will be plowing capital into one area.
Here’s the bottom line: The BMI is falling. We aren’t surprised given how stocks tend to struggle shortly after a presidential election.
Today’s study highlights how there’s high risk for big winners and big losers depending on the victor.
The better news is that new leadership in the Oval Office often means new leadership in the stock market!
Author: Lucas Downey